


Bitcoin price started a fresh decline below the $70,000 zone. BTC is consolidating and might continue to move down if it dips below $66,000. Bitcoin failed to stay above $70,500 and extended losses. The price is trading below $70,000 and the 100 hourly simple moving average. There is a bearish trend line forming with resistance…

My name is Godspower Owie, and I was born and brought up in Edo State, Nigeria. I grew up with my three siblings who have always been my idols and mentors, helping me to grow and understand the way of life. My parents are literally the backbone of my story. They’ve always supported me in…

Bitcoin has lost the $69,000 level as selling pressure intensifies and the market faces a wave of uncertainty that has erased weeks of recovery progress in a compressed timeframe. The breakdown is significant — and CryptoQuant data has identified a development in the on-chain flow data that adds a specific and historically significant supply dimension…

Bitcoin slid below $70,000 on Tuesday for the first time since April, touching an intraday low near $67,300 and extending a grind that has now erased roughly 45% of the asset's value since its $126,198 record last October. ZCash meanwhile, continues to outperform. Zcash is rising, but the Bitcoin selling is the familiar kind —…
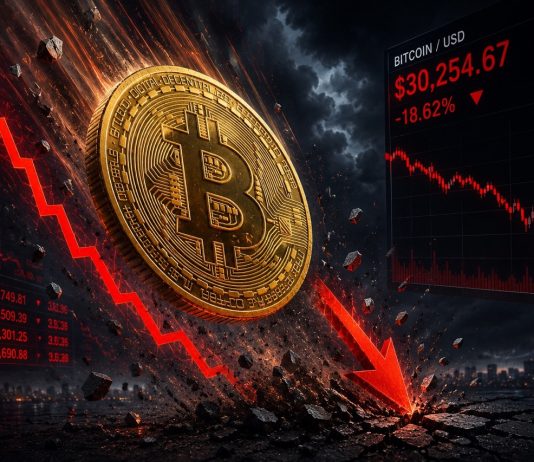
Bitcoin’s latest price action has given bearish analysts more reason to argue that the cryptocurrency is still moving through a deeper correction. Bitcoin has fallen back to $70,000, and selling pressure is building after another failed attempt to hold higher levels. Crypto analyst Crypto Lens has warned that Bitcoin may still need one final move…
Ronaldo is an experienced crypto enthusiast dedicated to the nascent and ever-evolving industry. With over five years of extensive research and unwavering dedication, he has cultivated a profound interest in the world of cryptocurrencies. Ronaldo's journey began with a spark of curiosity, which soon transformed into a deep passion for understanding the intricacies of this…

Crypto analyst Aralez has revealed that Bitcoin is entering an accumulation zone that could propel it to a new all-time high (ATH). The analyst signaled that BTC could rally to as high as $250,000 in the next bull market. Analyst Reveals Bitcoin Entering Major Accumulation Zone In an X post, Aralez stated that Bitcoin is…

Strive is preparing to expand its capital-raising capacity by $4.2 billion as the Bitcoin treasury company looks to fund additional BTC purchases, extending one of the fastest accumulation campaigns among public corporate holders. Chief executive Matt Cole said the company expects to increase the size of both its ASST and SATA at-the-market programs by $2.1…

Bitcoin saw its price retrace after initially moving upwards and clearing the resistance at $80,000. Eventually, though, the price ended up hitting major resistance at $82,000 and falling back downward. Now, the Bitcoin price seems to be stuck in a sideways movement that threatens to be the end of the recovery. However, this might not…
Bitcoin’s derivatives market has yet to fully heal from a violent shakeout last October, when roughly 71,000 BTC worth around $11 billion was wiped from open interest across major exchanges. Total open interest has not recovered to pre-event levels, leaving a gap of more than 24,000 BTC that signals many traders are still sitting on…