


Bitcoin has recently been spotlighted due to an intriguing buy signal identified on its hourly chart. This indication emerges amidst a notable fluctuation in Bitcoin’s price, setting the stage for potential short-term gains. Renowned crypto analyst Ali has highlighted a significant development on the hourly chart of Bitcoin, specifically noting a ‘buy signal’ detected by…

Bitcoin has observed a plunge during the past day, taking the asset’s price under $67,000. Here’s the historical support level that the asset could visit next. Bitcoin Is Now Not Far From The Short-Term Holder Realized Price As analyst James Van Straten pointed out in a post on X, the Realized Price of the Bitcoin…

Bitcoin is dumping when writing, cooling off from May highs of nearly $72,000. Down roughly 10% from all-time highs, there could be more losses on the way, at least looking at the candlestick arrangement in the daily chart. Now, Willy Woo, a Bitcoin on-chain analyst, thinks the drop is primarily because of the ongoing “miner…

The new week has been quite bearish for bitcoin, with the price witnessing major crashes below multiple support levels. After losing its footing above $71,000, it has plunged further below $67,000, signaling the start of a downtrend. Amid the uncertainty, a crypto analyst has presented the important levels to watch as Bitcoin makes it descent,…
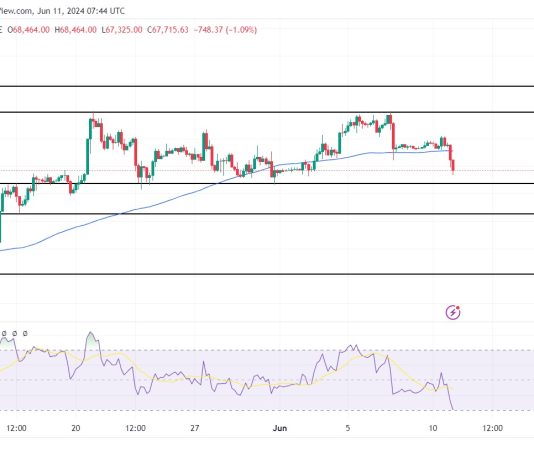
Bitcoin (BTC), the leading cryptocurrency by market capitalization, appears to be heading for further declines as market sentiment turns increasingly bearish. Recent analysis shows that BTC is struggling to maintain key support levels, and the overall mood among traders and investors is shifting towards caution. Several factors such as macroeconomic pressures, regulatory concerns, and technical…
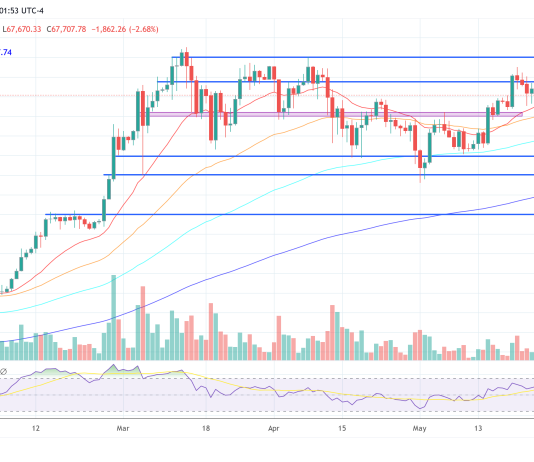
As the financial markets brace for the upcoming Federal Open Market Committee (FOMC) meeting on Wednesday, June 12th, the Bitcoin and crypto community is poised to assess the implications of any Federal Reserve announcements on digital assets such as Bitcoin. With the consensus forecast suggesting that the Federal Reserve will hold the federal funds rate…

Bitcoin price failed to stay above the $68,500 support zone. BTC extended losses and now showing bearish signs below the $68,800 level. Bitcoin started another decline from the $70,150 resistance zone. The price is trading below $68,800 and the 100 hourly Simple moving average. There is a key bearish trend line forming with resistance at…

According to this on-chain indicator, an analyst explained how the next potential local top for Bitcoin could be $89,200. Bitcoin CVDD “Assessing Tops” Metric Could Suggest Next Potential Top In a new post on X, analyst Ali Martinez has talked about where the next top for BTC could be based on the Cumulative Value Days…
Looking at the formation in the daily chart, there is no relief for Bitcoin at spot rates. Following the flash crash on June 6, prices reversed sharply from the $72,000 level, further highlighting the significance of the liquidation level. In the past, Bitcoin prices have recoiled from this level, with analysts expecting a short squeeze…
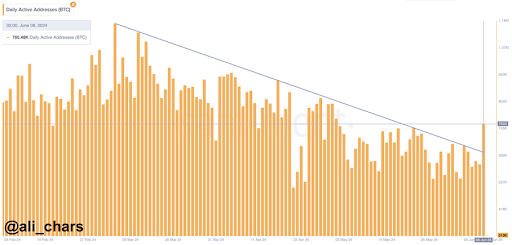
The Bitcoin on-chain metrics continue to show bullish signs that a parabolic breakout is imminent for the flagship crypto. The latest of these metrics is a significant turnaround in Bitcoin’s network activity, which could further provide bullish momentum for the crypto token. Bitcoin Sees Surge In Network Activity Crypto analyst Ali Martinez revealed in an…