


Recent market data also show that Bitcoin buyers have absorbed a key sell wall around $85,000, reducing one source of near-term resistance. At the same time, historical halving-cycle analysis is drawing attention to the period leading into Bitcoin’s fifth halving, currently expected around April 2028. BlackRock’s spot Bitcoin ETF has also recorded a sizable single-day…
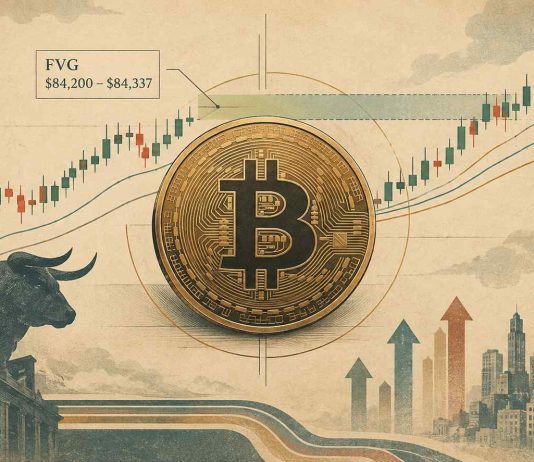
The setup comes as on-chain data shows that profit-taking remains relatively contained despite the latest Bitcoin price recovery. At the latest market snapshot, Bitcoin was trading near $84,196, up about 0.13%. While short-term momentum signals were mixed, the broader technical structure remained constructive, with most major moving averages continuing to point higher. Bitcoin Price Holds…

BTC traded around $85,311 in the technical analysis referenced for this report, while the broader market move also lifted Bitcoin above $85,000 during the session. The latest rally has placed the $85,300-$85,700 area near-term resistance, while the $80,000-$81,000 region remains an important support zone. The move has strengthened the short-term BTC price structure, but on-chain…

The Bitcoin price remains within a broader range, however, with technical support between $76,000 and $77,500 continuing to attract buyers. The latest data presents a mixed picture for Bitcoin price today. Glassnode identified substantial selling across spot and perpetual markets, while Santiment found that larger Bitcoin holders have been reducing exposure as smaller wallets continue…
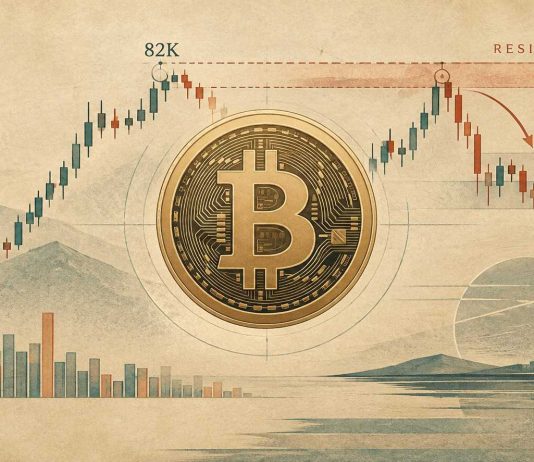
The pullback has not yet confirmed a bearish trend reversal. However, several on-chain and technical indicators show that Bitcoin is facing meaningful resistance while demand remains below the level typically associated with a sustained expansion. Bitcoin Price Faces an $83K-$85K Ceiling Glassnode data shows Bitcoin remains below a dense long-term holder cost-basis cluster around $83,000-$85,000.…

The latest catalyst is a $643 million net inflow into U.S. spot Bitcoin ETFs on September 3, the largest single-day inflow since January, according to Glassnode data. The move comes as BTC reclaims its Warm Supply Realized Price, a metric that tracks the average cost basis of coins that last moved between one week and…
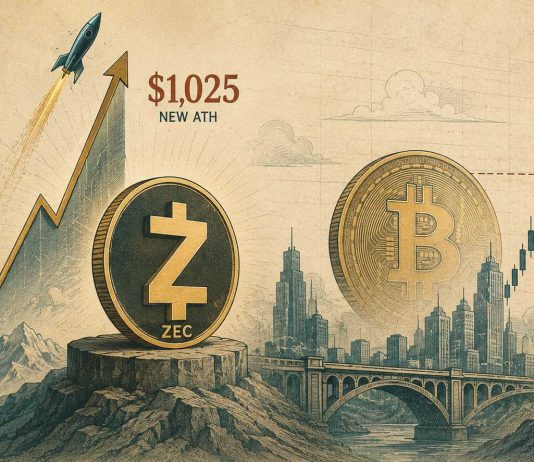
The move marks a sharp reversal for ZEC from the deep drawdown that followed its 2018 peak and represents a gain of roughly 6,300% from the sub-$20 levels highlighted by crypto analyst CryptoPatel in 2024. The rally has unfolded alongside renewed strength across the broader crypto market. Bitcoin (BTC), meanwhile, has been moving around the…

The move has also coincided with a shift in Glassnode’s Bitcoin Vector framework. The proprietary model moved into a Risk-On regime on August 21, marking a significant change from the Risk-Off phase that followed Bitcoin’s previous cycle high near $126,000. Glassnode’s public data confirms the August 21 inflection and describes the reading as an “Optimal…

The acquisition marks the company’s first reported Bitcoin purchase since June and brings its total holdings to 845,050 BTC. The latest purchase came shortly after Executive Chairman Michael Saylor posted “We’re ₿ack.” on X on August 30, alongside a chart tracking Strategy’s Bitcoin purchases. The timing of the post preceded the company’s disclosure of the…

At the same time, technical indicators show that the recent rally has become stretched, leaving Bitcoin price caught between a constructive medium-term structure and the risk of a deeper short-term pullback. Bitcoin (BTC) price chart. Source: Brave New Coin BTC climbed to around $81,500 during the latest advance before retreating toward the $79,000 area. The…