

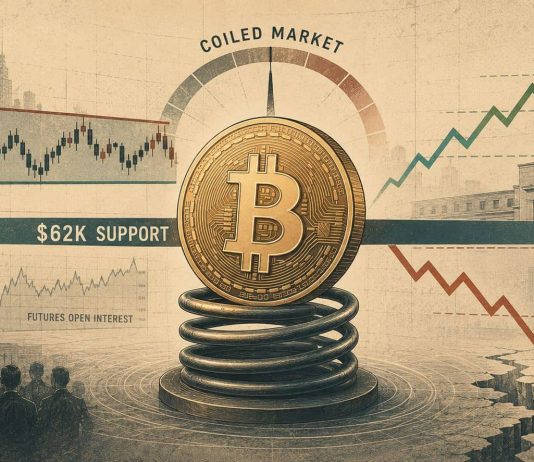
The Bitcoin price has struggled to build lasting upside momentum even as recent US inflation data has eased some pressure on risk assets. As of August 15, BTC was trading around $62,900, with market reports placing the cryptocurrency near the $63,000 level after a subdued reaction to softer US economic data. The setup leaves Bitcoin…

The Bitcoin price has remained above several short-term technical averages, while improving network activity offers another factor for the market to monitor. Recent analysis places Bitcoin in a consolidation phase after its previous decline. BTC has established a series of higher lows in the short term, suggesting that buyers have continued to defend lower levels.…

While on-chain data presents mixed signals, the combination of recent Bitcoin price action above the weekly 200-period moving average (MA200), improving short-term technicals, and historical market behavior has renewed discussion about whether the largest cryptocurrency is laying the groundwork for its next recovery phase. Weekly MA200 Emerges as a Key Support for Bitcoin Price Prediction…

The latest Bitcoin price action has produced a mixed technical picture, with short-term momentum indicators showing some positive signals while longer-term moving averages continue to point to resistance overhead. Bitcoin was trading around $64,880 in the technical data reviewed for this analysis, down approximately 1.82% on the session. More recent market data also showed BTC…

The market’s next major directional signal could come from a break of the $62,200-$66,400 range, as Bitcoin continues to consolidate below a multi-month descending trendline. The setup is developing at a time when market positioning has become more complicated. Bitcoin outperformed major traditional assets on August 17, but its three-month performance relative to equities remains…

The BTC price remains well below its late-2025 peak, however, technical indicators continue to show resistance overhead. Glassnode’s Seller Exhaustion Constant has declined sharply during 2026. The metric is designed to identify potential low-risk market bottoms by combining the percentage of Bitcoin supply in profit with 30-day price volatility. Its latest reading is around 0.0164, above…

The move has also coincided with a shift in Glassnode’s Bitcoin Vector framework. The proprietary model moved into a Risk-On regime on August 21, marking a significant change from the Risk-Off phase that followed Bitcoin’s previous cycle high near $126,000. Glassnode’s public data confirms the August 21 inflection and describes the reading as an “Optimal…

The latest Bitcoin price action shows BTC holding above several short- and medium-term moving averages, while repeated attempts to establish a sustained move above $65,000 have so far met resistance. At the time of the latest technical snapshot, Bitcoin was trading around $65,118, up roughly 0.32% on the day. The move has kept BTC above…

Bitcoin price was trading around $80,500 on Bitstamp in the latest technical reading, up 3.11% on the session. While the price remains elevated, momentum indicators are showing signs of strain. The 14-period RSI stands at 81, placing it firmly in traditionally overbought territory. The latest concern comes from crypto trader BitcoinHypers, who identified what he…
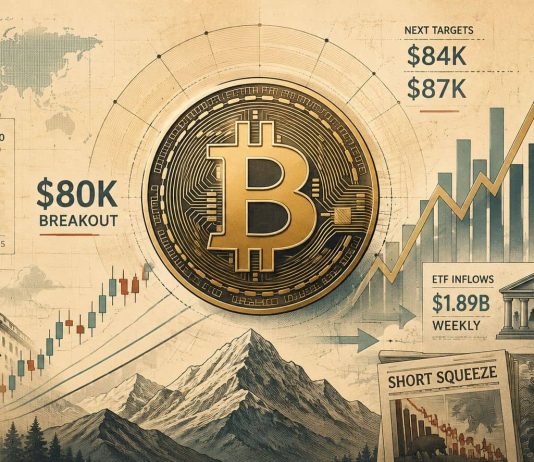
The move has placed the Bitcoin price back at a key technical level, while renewed spot demand and stronger exchange-traded fund (ETF) flows are providing additional support for the advance. At the time of writing, Bitcoin was trading around $79,800 after reaching a 24-hour high near $81,280 on August 25. Market data shows BTC has…