

The XRP price was around $1.40 in early September, leaving the token well below its 2025 record but close to several technical levels that could determine its near-term direction. The current setup has attracted attention because two different time frames are producing potentially significant signals. On the monthly chart, crypto analyst Ali Martinez has identified…
Several analysts are now watching whether the XRP price can establish a sustainable base above its recent lows, while longer-term cycle analysis points to the possibility of a broader recovery. At the center of the bullish case is a 13-month cycle identified by TradingView analyst Fractical. The analysis suggests XRP’s latest bearish swing low occurred…
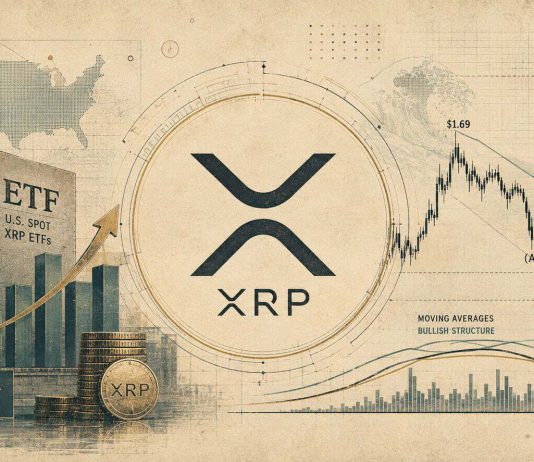
While recent price action has cooled, continued demand from U.S. spot XRP ETFs and a largely constructive moving-average structure have kept the broader bullish setup in focus. A 4-hour Elliott Wave analysis by TradingView contributor Kap_Waves suggests XRP may undergo another pullback before potentially entering a larger Wave 3 advance. The projected corrective area sits…
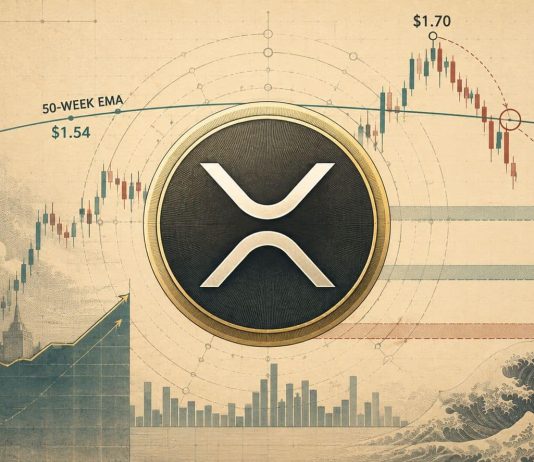
Chart analyst ChartNerdTA has flagged the 50-week exponential moving average (EMA), currently around $1.54, as an important level for determining whether the recent recovery can extend or whether XRP price faces a deeper retracement. The caution comes after XRP climbed from below $1 earlier this month to briefly reach around $1.70. The move pushed the…

The recent XRP price rebound has shifted the short-term technical structure in favor of buyers, although several resistance levels and overbought momentum readings could still limit the pace of the advance. XRP traded around $1.50-$1.52 on August 24, according to current market data, after briefly moving as high as roughly $1.70 during the recent rally.…
The move has pushed the XRP price above several important technical levels and brought the $1.50 area back into focus as the next major resistance. The rally accelerated after XRP reclaimed the $1.00 level and moved through the $1.25-$1.30 region. By August 21, XRP was trading around $1.37-$1.40 across major market data sources, with recent…
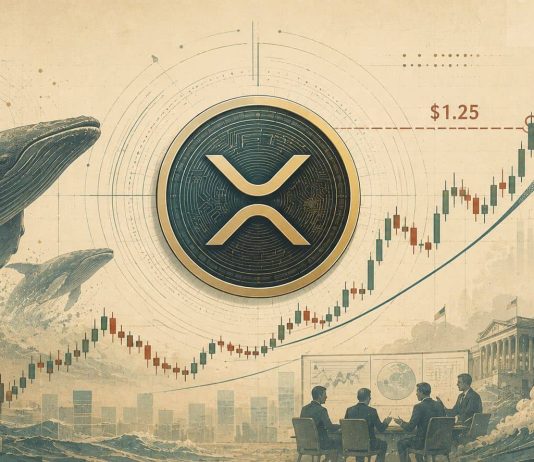
The move has taken XRP above its 50-day simple moving average near $1.07 and placed the $1.25 region at the center of the latest XRP price prediction. The rally follows a period in which XRP struggled to hold above $1.00. Recent market data showed the token moving from around $1.00 toward the $1.15-$1.25 range, while leveraged…
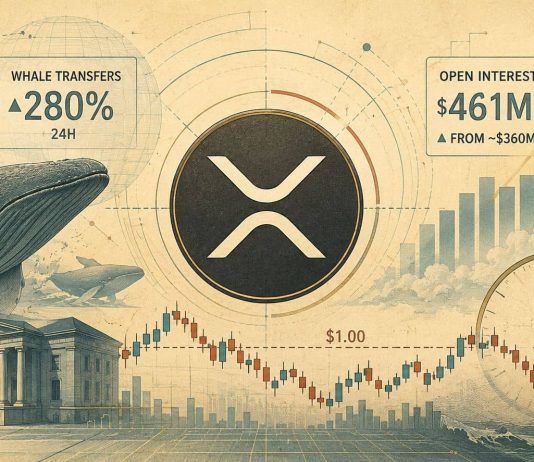
The combination has placed the XRP price at an important technical juncture, although the latest data does not yet establish a confirmed bullish reversal. On-chain data cited by market analysts shows that transactions worth more than $1 million on the XRP Ledger increased 280% over a 24-hour period, with more than 38 such transfers recorded.…
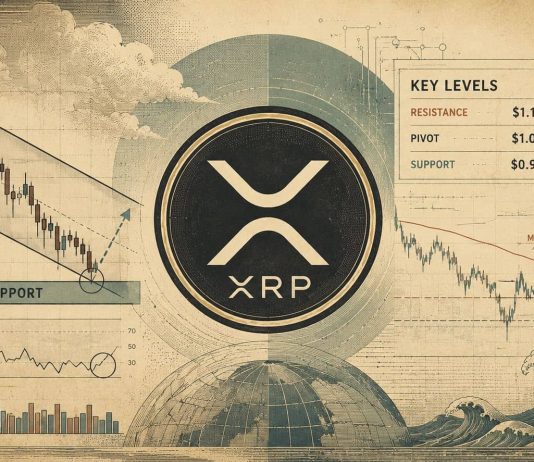
Short-term XRP price chart structures point to the possibility of a relief bounce, but broader technical indicators continue to show that sellers have the upper hand. At the time of the latest TradingView snapshot cited in the analysis, XRP/USD was around $1.0026, up roughly 1.03%. The move followed a period of weakness that saw XRP…
The weakness has left the XRP price vulnerable to another decline, with technical levels around $0.99 and $0.97 emerging as important areas to watch. The token was trading around $1.00 on August 15 after attempting to stabilize near the psychological support level. Recent price action has failed to establish a sustained recovery above nearby resistance,…